
Cryptocurrencies have been taken hit after hit, with only a few of the cryptocurrencies begging to be saved from the onslaught downtrend. These conditions have arisen from inflation, regulatory decisions, geopolitical crises, and other issues. This situation has been termed as the crypto winter that is being discussed as a positive attribute for the long-term success of cryptocurrencies and the digital assets they promote.
Co-founder Vitalik Buterin has mentioned such a bear market for cryptocurrencies as positive by highlighting some silver linings. He mentions the presence of a bear market will ensure a lot of speculative investors looking for quick gains will be turning into investor sentiment and understand the project more than worrying about % gains. This would also result in the closing of various speculative and hype projects while ensuring the survival of authentic product or service-oriented cryptocurrencies. These facts do sound true to the foundations of Ethereum.
ETH still holds the second largest market capitalization of $323 billion. Having lost only 45% since its all-time high values in November 2021, ETH seems to have some fundamental support as it lost lesser value than its counterparts. The rumoured ETH 2.0 is already functional but hasn’t completely moved to proof of stake protocol as of yet. People earn passive incomes without mining but staking their ETH holdings and running validator nodes. Hence the growth of ETH tokens seems inevitable as per ETH price prediction.
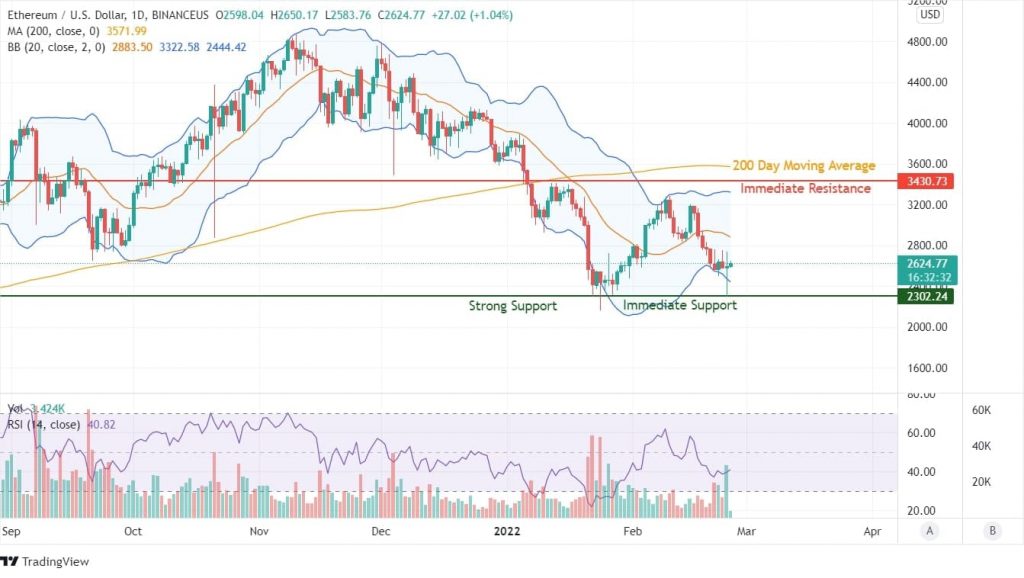
Closely auditing the price trend in the last two months showcases a bounce-back trend from the support zones of $2300, indicating a probability of applying brakes to the continuous downtrend rally. With ETH hitting a fresh monthly high of $3300, the sudden slide of price action can be derived from the fact that 200 DMA has become too large of a resistance forcing investors to treat price bounces as a way of booking smaller profits. In terms of Indicators, RSI is clear of the downtrend but more towards a neutral stance. Falling below $2300 levels will also force RSI to turn into oversold levels. Once an oversold indication is delivered, prices tend to revive only post a decent sell-off.
Another important price trend dedicating indicator of Bollinger Bands shows prices to be trading above the lower band. Such a price trend can be treated as positive only after it crosses the median band of BB. $3430 and 200 DMA both will be strong resistance to any upside movement as buyers would be attempting to make profits off their short-term holdings.